
The PSD School
Section 10 by Lars Stenberg ESDE AB.
How to select the main lens for a triangulation probe
In section 9 we studied what happened when a collimated light beam strikes different types of surfaces and we found, on that occasion, that the simplest case - concerning the performance of a triangulation probe - is if the reflected surface gives rise to a large share of Lambert light dispersion. A triangulation probe also functions with Gaussian light dispersion but the smaller the beam angle of the Gaussian light dispersion the smaller the measurement area becomes.
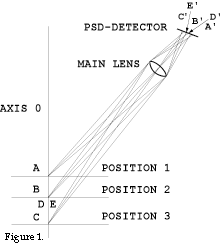
In order to understand the requirements we should make on the main lens, we shall now investigate how a light spot that strikes a surface is represented on the PSD detector‘s surface. Figure 1 shows the beam path in principle. From figure 1 it is evident that point A, corresponding to the measurement area‘s nearest position, is represented on point A, on the PSD detector. In the figure the points where B,C,D and N are represented are also plotted. With the aid of the formula
It is also clear that the distance B´A´is a little longer than the distance C´B´in figure 1,
 to be more precise (4,2425 - 3,9971) mm = 0,2454 mm. In an analogous way the
distance B´D´ will also be somewhat longer than the distance E´B´ in figure 1. If the
spot DE, which is formed when the collimated light beam strikes the measurement surface in
position 2, is symmetrical around the axis O the result will be that the PSD detector will
produce a signal deviation that corresponds to the spot being represented a little closer
to A´than right on point B´. This is due to the fact that the PSD detector produces a
signal that corresponds to the position of the "light gravity centre". As the
same number of photons (the spot was indeed symmetrical around the axis O) are dispersed
over a longer distance in the direction of A´ than the photons that are dispersed in the
direction of C´, so the of the "light gravity centre" position is shifted a
little in direction of A´. Observe that the of the "light gravity centre" shift
towards A´ takes place despite the light spot being symmetrical around the axis O and
independently of any possible image fault in the main lens.
to be more precise (4,2425 - 3,9971) mm = 0,2454 mm. In an analogous way the
distance B´D´ will also be somewhat longer than the distance E´B´ in figure 1. If the
spot DE, which is formed when the collimated light beam strikes the measurement surface in
position 2, is symmetrical around the axis O the result will be that the PSD detector will
produce a signal deviation that corresponds to the spot being represented a little closer
to A´than right on point B´. This is due to the fact that the PSD detector produces a
signal that corresponds to the position of the "light gravity centre". As the
same number of photons (the spot was indeed symmetrical around the axis O) are dispersed
over a longer distance in the direction of A´ than the photons that are dispersed in the
direction of C´, so the of the "light gravity centre" position is shifted a
little in direction of A´. Observe that the of the "light gravity centre" shift
towards A´ takes place despite the light spot being symmetrical around the axis O and
independently of any possible image fault in the main lens.The aforementioned shift of the of the "light gravity centre" position towards A´ can, however, be minimised if the light spot, which the collimated beam gives rise to when it strikes the measurement surface, is made as small as possible. The reader can now better understand why we dedicated sections 4 to 8 of the PSD school to learning how to minimise the light spot‘s diameter on the measurement surface as much as possible. One of the reasons is that we thereby minimise the of the "light gravity centre" shift towards A´ in figure 1.
The small residual error that, despite everything, remains can be measured and placed in a linearisation table. When the PSD detector emits a measurement signal - indicating the position of the light spot image on the PSD detector - to the computer that evaluates the signal and converts it into distance from the measured surface to the triangulation probe, it is then easy to compensate for such small residual errors.
We have now seen how we can reduce the of the "light gravity centre" shift towards A´ by ensuring that the light spot diameter on the measurement surface is as small as possible. But we have still not taken account of possible image faults in the main lens.
There is a very good tool for investigating how the image on the PSD detector appears when the light spot is reproduced with the aid of the main lens and this is called a spot diagram. In order to be able to calculate a spot diagram it is essential to use a computer containing an optical calculation program that, inter alia, can calculate spot diagrams. The computer then calculates the exact position of the light beams - that emanate from one of the points of the object plane of the lens selected by the operator - strikes the image plane. The number of light beams (from tens to several thousands) selected by the operator are distributed evenly across the aperture of the lens. The result is obtained either in the form of a diagram that, for example, with the aid of small crosses showing where the light beams strike the image plane, or in the form of a co-ordinate table that provides the x and y co-ordinates for where the light beams strike the image plane. The diagram provides an immediate, qualitative and visual experience on the capacity of the optics in question to give rise to a sharp image while it is necessary to use the co-ordinate table if one wishes to quantify the performance of the lens. Frequently, the calculation programs for optical spot diagrams also show the co-ordinates of the origin of the beams in the object plane as well as showing the co-ordinates of the spot centre in the image plane. The spot‘s centre in the image plane can thereby be shown at least according to two different methods. Either one shows the co-ordinates for the point where the so-called chief ray cuts the image plane 1 (see figure 2), or also the computer calculates the average value for all x and y co-ordinates in the aforementioned table.
 This
average value corresponds to just that of the "light gravity centre" that the
PSD detector indicates the position of. In addition, the computer also calculates the
radius of the spot and indicates the spot radius in µm. It is also possible to obtain a
very good idea as to how - in linear terms - different optical systems represent the
spot‘s position on the PSD detector when the distance of the measurement surface from
the triangulation probe is altered. To begin with we should therefore study some different
spot diagrams for a main lens unit that only comprises a single lens.
This
average value corresponds to just that of the "light gravity centre" that the
PSD detector indicates the position of. In addition, the computer also calculates the
radius of the spot and indicates the spot radius in µm. It is also possible to obtain a
very good idea as to how - in linear terms - different optical systems represent the
spot‘s position on the PSD detector when the distance of the measurement surface from
the triangulation probe is altered. To begin with we should therefore study some different
spot diagrams for a main lens unit that only comprises a single lens.Figure 3a shows a so-called spot diagram where the
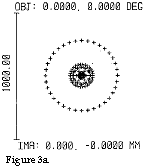 object plane and the image plane are at right
angles to the optical axis and the light beams start from the point where the optical axis
cuts the object plane. All other parameters agree with what is indicated in section 3 (DE
= 156,649, EF = 42,613 and f E = 32,81).
Figure 3b shows the spot diagram obtained when the object plane and the image plane form
the angles that are calculated in section 3 of the PSD school, namely
a=40° and g=72,038°. It does not matter that a=40° since the light beams that generate the spot diagram issue
from a point on the
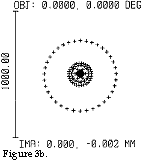 optical axis without any difference between the spot diagram in figure 3a and 3b is due to
the image plane forming the angle g=72.038° towards the
optical axis instead of 90°. If we compare the spot diagram in figure 3a with the spot
diagram in figure 3b it is hard to see any difference with the naked eye. Nevertheless,
according to the computer the focal point of the light spot is moved to 2µm in the
direction of A´ on figure 1. This fault is so small that it is easy to compensate for
this when the triangulation probe is linearised.
optical axis without any difference between the spot diagram in figure 3a and 3b is due to
the image plane forming the angle g=72.038° towards the
optical axis instead of 90°. If we compare the spot diagram in figure 3a with the spot
diagram in figure 3b it is hard to see any difference with the naked eye. Nevertheless,
according to the computer the focal point of the light spot is moved to 2µm in the
direction of A´ on figure 1. This fault is so small that it is easy to compensate for
this when the triangulation probe is linearised.Let us now see what happens when the measurement
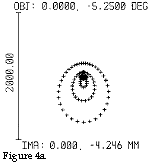 surface is in position 1, ie. at point A on
figure 1. Figure 4a shows the spot diagram when the chief ray is used as a reference and
figure 4b shows the spot diagram when the centroid - the of the "light gravity
centre" - is reference.
surface is in position 1, ie. at point A on
figure 1. Figure 4a shows the spot diagram when the chief ray is used as a reference and
figure 4b shows the spot diagram when the centroid - the of the "light gravity
centre" - is reference.As appears from figure 4a and 4b there is no difference between the spot diagrams themselves (after all it is exactly the same spot diagram as opposed to figures 3a and 3b where the image plane in the case of
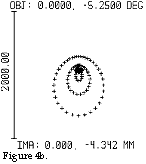 3a was perpendicular to the optical axis and - in the case of 3b
- formed the angle 72,038° against the optical axis) but we can, from the deformed
appearance, suspect that the of the "light gravity centre" does not coincide
with the chief ray‘s intersection point with the image plane. The calculations also
show that the of the "light gravity centre" is at a distance of 4,342 mm from
the optical axis whereas the intersection point of the main beam is at a distance of 4,246
mm. The difference is 96 µm. Observe that this difference is only due to aberrations in
the lens since all the light beams that are calculated in the spot diagram were emitted
from the same point in the object plane. The computer shows that the spot radius is 642
µm. ie. the spot‘s greatest length is 1,284 mm. This is not a performance that
impresses and if, in addition, we were to take into consideration that the spot in reality
is not point-shaped then the result will be even worse. There are maybe readers that
believe that it is wholly in order to eliminate these faults in connection with the
calibration of the triangulation probe but I do not agree with it. If the faults are large
ones and are changed rapidly then the pre-calibrated triangulation probes become extremely
sensitive for even small shifts of the parts involved.
3a was perpendicular to the optical axis and - in the case of 3b
- formed the angle 72,038° against the optical axis) but we can, from the deformed
appearance, suspect that the of the "light gravity centre" does not coincide
with the chief ray‘s intersection point with the image plane. The calculations also
show that the of the "light gravity centre" is at a distance of 4,342 mm from
the optical axis whereas the intersection point of the main beam is at a distance of 4,246
mm. The difference is 96 µm. Observe that this difference is only due to aberrations in
the lens since all the light beams that are calculated in the spot diagram were emitted
from the same point in the object plane. The computer shows that the spot radius is 642
µm. ie. the spot‘s greatest length is 1,284 mm. This is not a performance that
impresses and if, in addition, we were to take into consideration that the spot in reality
is not point-shaped then the result will be even worse. There are maybe readers that
believe that it is wholly in order to eliminate these faults in connection with the
calibration of the triangulation probe but I do not agree with it. If the faults are large
ones and are changed rapidly then the pre-calibrated triangulation probes become extremely
sensitive for even small shifts of the parts involved.We shall therefore - in the next section - study different lens types that do not introduce such large linear deviations as a single biconvex lens.
1 A chief ray goes from a point in the object plane through the intersection point between the system‘s optical axis and the system‘s so-called aperture diaphragm. The aperture diaphragm limits the diameter of a beam that is parallel with the system‘s optical axis. An axial ray is a light ray that derives from the intersection point between the system‘s optical axis and the object
|
« home